Python for Statistical Modelling
Feng Li
School of Statistics and Mathematics
Central University of Finance and Economics
Statistical Data Modeling
- The curricula for most introductory statisics courses are mostly focused on conducting statistical hypothesis tests as the primary means for interest: t-tests, chi-squared tests, analysis of variance, etc. Such tests seek to esimate whether groups are "significantly different "or effects are "statistically significant", a concept that is poorly understood, and hence, often misused by practioners. Even when interpreted correctly, statistical significance (as characterized by a small p-value) is a questionable goal for statistical inference, as it is not a measure of evidence in any statistical sense.
- A far more powerful approach to statistical analysis involves building flexible models with the overarching aim of estimating quantities of interest. This section of the tutorial illustrates how to use Python to build statistical models of low to moderate difficulty from scratch, and use them to extract estimates and associated measures of uncertainty. These estimates can then be passed on to individuals with domain expertise who can then appraise them for "real-world" significance.
Regression models with LSE
A general, primary goal of many statistical data analysis tasks is to relate the influence of one variable on another. For example, we may wish to know how different medical interventions influence the incidence or duration of disease, or perhaps a how baseball player's performance varies as a function of age.
import numpy as np
import matplotlib.pyplot as plt
x = np.array([2.2, 4.3, 5.1, 5.8, 6.4, 8.0])
y = np.array([0.4, 10.1, 14.0, 10.9, 15.4, 18.5])
plt.plot(x,y,'ro')
[<matplotlib.lines.Line2D at 0x7f9af6900f10>]

We can build a model to characterize the relationship between $X$ and $Y$, recognizing that additional factors other than $X$ (the ones we have measured or are interested in) may influence the response variable $Y$.
$y_i = f(x_i) + \epsilon_i$
where $f$ is some function, for example a linear function:
$y_i = \beta_0 + \beta_1 x_i + \epsilon_i$
and $\epsilon_i$ accounts for the difference between the observed response $y_i$ and its prediction from the model $\hat{y_i} = \beta_0 + \beta_1 x_i$. This is sometimes referred to as process uncertainty.
We would like to select $\beta_0, \beta_1$ so that the difference between the predictions and the observations is zero, but this is not usually possible. Instead, we choose a reasonable criterion: *the smallest sum of the squared differences between $\hat{y}$ and $y$*.
$$R^2 = \sum_i (y_i - [\beta_0 + \beta_1 x_i])^2 = \sum_i \epsilon_i^2 $$Squaring serves two purposes: (1) to prevent positive and negative values from cancelling each other out and (2) to strongly penalize large deviations. Whether the latter is a good thing or not depends on the goals of the analysis.
In other words, we will select the parameters that minimize the squared error of the model.
def ss(theta, x, y):
    return np.sum((y - theta[0] - theta[1]*x) ** 2)
ss([0,1],x,y)
333.35
from scipy.optimize import fmin

b0,b1 = fmin(ss, [0,1], args=(x,y))
b0,b1
Optimization terminated successfully.
         Current function value: 21.375000
         Iterations: 79
         Function evaluations: 153
(-4.350013603887088, 3.0000002915386412)
plt.plot(x, y, 'ro')
plt.plot([0,10], [b0, b0+b1*10])
[<matplotlib.lines.Line2D at 0x7f9af24f1b80>]

plt.plot(x, y, 'ro')
plt.plot([0,10], [b0, b0+b1*10])
for xi, yi in zip(x,y):
    plt.plot([xi]*2, [yi, b0+b1*xi], 'k:')
plt.xlim(2, 9); plt.ylim(0, 20)
(0.0, 20.0)

Minimizing the sum of squares is not the only criterion we can use; it is just a very popular (and successful) one. For example, we can try to minimize the sum of absolute differences:
def sabs(theta, x, y):
    return np.sum(np.abs(y - theta[0] - theta[1]*x))

b0,b1 = fmin(sabs, [0,1], args=(x,y))
print(b0, b1)
plt.plot(x, y, 'ro')
plt.plot([0,10], [b0, b0+b1*10])
Optimization terminated successfully.
         Current function value: 10.162463
         Iterations: 39
         Function evaluations: 77
0.0015717044449411344 2.3123174318112456
[<matplotlib.lines.Line2D at 0x7f9af2455220>]

We are not restricted to a straight-line regression model; we can represent a curved relationship between our variables by introducing polynomial terms. For example, a cubic model:
$y_i = \beta_0 + \beta_1 x_i + \beta_2 x_i^2 + \epsilon_i$
def ss2(theta, x, y):
    return np.sum((y - theta[0] - theta[1]*x - theta[2]*(x**2)) ** 2)

b0,b1,b2 = fmin(ss2, [1,1,-1], args=(x,y))
print(b0, b1, b2)
plt.plot(x, y, 'ro')
xvals = np.linspace(0, 10, 100)
plt.plot(xvals, b0 + b1*xvals + b2*(xvals**2))
Optimization terminated successfully.
         Current function value: 14.001110
         Iterations: 198
         Function evaluations: 372
-11.074818603916224 6.05769759480417 -0.3026810570883315
[<matplotlib.lines.Line2D at 0x7f9af24cba30>]

Although polynomial model characterizes a nonlinear relationship, it is a linear problem in terms of estimation. That is, the regression model $f(y | x)$ is linear in the parameters.
For some data, it may be reasonable to consider polynomials of order>2. For example, consider the relationship between the number of home runs a baseball player hits and the number of runs batted in (RBI) they accumulate; clearly, the relationship is positive, but we may not expect a linear relationship.
import pandas as pd

def ss3(theta, x, y):
    return np.sum((y - theta[0] - theta[1]*x - theta[2]*(x**2) - theta[3]*(x**3)) ** 2)

bb = pd.read_csv("data/baseball.csv", index_col=0)
plt.plot(bb.hr, bb.rbi, 'r.')
b0,b1,b2,b3 = fmin(ss3, [0,1,-1,0], args=(bb.hr, bb.rbi))
xvals = np.arange(40)
plt.plot(xvals, b0 + b1*xvals + b2*(xvals**2) + b3*(xvals**3))
Optimization terminated successfully.
         Current function value: 4274.128398
         Iterations: 230
         Function evaluations: 407
[<matplotlib.lines.Line2D at 0x7f9aec5b6eb0>]

Of course, we need not fit least squares models by hand. The statsmodels package implements least squares models that allow for model fitting in a single line:
import statsmodels.api as sm

straight_line = sm.OLS(y, sm.add_constant(x)).fit()
straight_line.summary()
/usr/lib/python3/dist-packages/statsmodels/stats/stattools.py:74: ValueWarning: omni_normtest is not valid with less than 8 observations; 6 samples were given.
  warn("omni_normtest is not valid with less than 8 observations; %i "
| Dep. Variable: | y | R-squared: | 0.891 |
|---|---|---|---|
| Model: | OLS | Adj. R-squared: | 0.864 |
| Method: | Least Squares | F-statistic: | 32.67 |
| Date: | Sat, 13 Nov 2021 | Prob (F-statistic): | 0.00463 |
| Time: | 19:31:55 | Log-Likelihood: | -12.325 |
| No. Observations: | 6 | AIC: | 28.65 |
| Df Residuals: | 4 | BIC: | 28.23 |
| Df Model: | 1 | ||
| Covariance Type: | nonrobust |
| coef | std err | t | P>|t| | [0.025 | 0.975] | |
|---|---|---|---|---|---|---|
| const | -4.3500 | 2.937 | -1.481 | 0.213 | -12.505 | 3.805 |
| x1 | 3.0000 | 0.525 | 5.716 | 0.005 | 1.543 | 4.457 |
| Omnibus: | nan | Durbin-Watson: | 2.387 |
|---|---|---|---|
| Prob(Omnibus): | nan | Jarque-Bera (JB): | 0.570 |
| Skew: | 0.359 | Prob(JB): | 0.752 |
| Kurtosis: | 1.671 | Cond. No. | 17.9 |
Notes:
[1] Standard Errors assume that the covariance matrix of the errors is correctly specified.
from statsmodels.formula.api import ols as OLS

data = pd.DataFrame(dict(x=x, y=y))
cubic_fit = OLS('y ~ x + I(x**2)', data).fit()

cubic_fit.summary()
/usr/lib/python3/dist-packages/statsmodels/stats/stattools.py:74: ValueWarning: omni_normtest is not valid with less than 8 observations; 6 samples were given.
  warn("omni_normtest is not valid with less than 8 observations; %i "
| Dep. Variable: | y | R-squared: | 0.929 |
|---|---|---|---|
| Model: | OLS | Adj. R-squared: | 0.881 |
| Method: | Least Squares | F-statistic: | 19.50 |
| Date: | Sat, 13 Nov 2021 | Prob (F-statistic): | 0.0191 |
| Time: | 19:31:55 | Log-Likelihood: | -11.056 |
| No. Observations: | 6 | AIC: | 28.11 |
| Df Residuals: | 3 | BIC: | 27.49 |
| Df Model: | 2 | ||
| Covariance Type: | nonrobust |
| coef | std err | t | P>|t| | [0.025 | 0.975] | |
|---|---|---|---|---|---|---|
| Intercept | -11.0748 | 6.013 | -1.842 | 0.163 | -30.211 | 8.062 |
| x | 6.0577 | 2.482 | 2.441 | 0.092 | -1.840 | 13.955 |
| I(x ** 2) | -0.3027 | 0.241 | -1.257 | 0.298 | -1.069 | 0.464 |
| Omnibus: | nan | Durbin-Watson: | 2.711 |
|---|---|---|---|
| Prob(Omnibus): | nan | Jarque-Bera (JB): | 0.655 |
| Skew: | -0.809 | Prob(JB): | 0.721 |
| Kurtosis: | 2.961 | Cond. No. | 270. |
Notes:
[1] Standard Errors assume that the covariance matrix of the errors is correctly specified.
statsmodels
statsmodels is a Python module that provides classes and functions for the estimation of many different statistical models, as well as for conducting statistical tests, and statistical data exploration. It supports
- Statistics and Tests
- Regression
- Generalized Linear Models
- Discrete and Count Models
- Factor analysis, Principal Component Analysis
- Time Series Models
- ...
Model Selection
How do we choose among competing models for a given dataset? More parameters are not necessarily better, from the standpoint of model fit. For example, fitting a 9-th order polynomial to the sample data from the above example certainly results in an overfit.
def calc_poly(params, data):
        x = np.c_[[data**i for i in range(len(params))]]
        return np.dot(params, x)

ssp = lambda theta, x, y: np.sum((y - calc_poly(theta, x)) ** 2)
betas = fmin(ssp, np.zeros(10), args=(x,y), maxiter=1e6)
plt.plot(x, y, 'ro')
xvals = np.linspace(0, max(x), 100)
plt.plot(xvals, calc_poly(betas, xvals))
Optimization terminated successfully.
         Current function value: 7.015262
         Iterations: 663
         Function evaluations: 983
[<matplotlib.lines.Line2D at 0x7f9aea2bed60>]

One approach is to use an information-theoretic criterion to select the most appropriate model. For example Akaike's Information Criterion (AIC) balances the fit of the model (in terms of the likelihood) with the number of parameters required to achieve that fit. We can easily calculate AIC as:
$$AIC = n \log(\hat{\sigma}^2) + 2p$$where $p$ is the number of parameters in the model and $\hat{\sigma}^2 = RSS/(n-p-1)$.
Notice that as the number of parameters increase, the residual sum of squares goes down, but the second term (a penalty) increases.
To apply AIC to model selection, we choose the model that has the lowest AIC value.
n = len(x)

aic = lambda rss, p, n: n * np.log(rss/(n-p-1)) + 2*p

RSS1 = ss(fmin(ss, [0,1], args=(x,y)), x, y)
RSS2 = ss2(fmin(ss2, [1,1,-1], args=(x,y)), x, y)

print(aic(RSS1, 2, n), aic(RSS2, 3, n))
Optimization terminated successfully.
         Current function value: 21.375000
         Iterations: 79
         Function evaluations: 153
Optimization terminated successfully.
         Current function value: 14.001110
         Iterations: 198
         Function evaluations: 372
15.781658357173654 17.675936801895737
Hence, we would select the 2-parameter (linear) model.
Logistic Regression
Fitting a line to the relationship between two variables using the least squares approach is sensible when the variable we are trying to predict is continuous, but what about when the data are dichotomous?
- male/female
- pass/fail
- died/survived
Let's consider the problem of predicting survival in the Titanic disaster, based on our available information. For example, lets say that we want to predict survival as a function of the fare paid for the journey.
titanic = pd.read_excel("data/titanic.xls", "titanic")
titanic.name
0                         Allen, Miss. Elisabeth Walton
1                        Allison, Master. Hudson Trevor
2                          Allison, Miss. Helen Loraine
3                  Allison, Mr. Hudson Joshua Creighton
4       Allison, Mrs. Hudson J C (Bessie Waldo Daniels)
                             ...
1304                               Zabour, Miss. Hileni
1305                              Zabour, Miss. Thamine
1306                          Zakarian, Mr. Mapriededer
1307                                Zakarian, Mr. Ortin
1308                                 Zimmerman, Mr. Leo
Name: name, Length: 1309, dtype: object
jitter = np.random.normal(scale=0.02, size=len(titanic))
plt.scatter(np.log(titanic.fare), titanic.survived + jitter, alpha=0.3)
plt.yticks([0,1])
plt.ylabel("survived")
plt.xlabel("log(fare)")
/home/fli/.local/lib/python3.9/site-packages/pandas/core/arraylike.py:364: RuntimeWarning: divide by zero encountered in log
  result = getattr(ufunc, method)(*inputs, **kwargs)
Text(0.5, 0, 'log(fare)')

I have added random jitter on the y-axis to help visualize the density of the points, and have plotted fare on the log scale.
Clearly, fitting a line through this data makes little sense, for several reasons. First, for most values of the predictor variable, the line would predict values that are not zero or one. Second, it would seem odd to choose least squares (or similar) as a criterion for selecting the best line.
x = np.log(titanic.fare[titanic.fare>0])
y = titanic.survived[titanic.fare>0]
betas_titanic = fmin(ss, [1,1], args=(x,y))
Optimization terminated successfully.
         Current function value: 277.621917
         Iterations: 55
         Function evaluations: 103
jitter = np.random.normal(scale=0.02, size=len(titanic))
plt.scatter(np.log(titanic.fare), titanic.survived + jitter, alpha=0.3)
plt.yticks([0,1])
plt.ylabel("survived")
plt.xlabel("log(fare)")
plt.plot([0,7], [betas_titanic[0], betas_titanic[0] + betas_titanic[1]*7.])
[<matplotlib.lines.Line2D at 0x7f9aea1d7d30>]

If we look at this data, we can see that for most values of fare, there are some individuals that survived and some that did not. However, notice that the cloud of points is denser on the "survived" (y=1) side for larger values of fare than on the "died" (y=0) side.
Stochastic model
Rather than model the binary outcome explicitly, it makes sense instead to model the probability of death or survival in a stochastic model. Probabilities are measured on a continuous [0,1] scale, which may be more amenable for prediction using a regression line. We need to consider a different probability model for this exerciese however; let's consider the Bernoulli distribution as a generative model for our data:
where $y = \{0,1\}$ and $p \in [0,1]$. So, this model predicts whether $y$ is zero or one as a function of the probability $p$. Notice that when $y=1$, the $1-p$ term disappears, and when $y=0$, the $p$ term disappears.
So, the model we want to fit should look something like this:
However, since $p$ is constrained to be between zero and one, it is easy to see where a linear (or polynomial) model might predict values outside of this range. We can modify this model sligtly by using a link function to transform the probability to have an unbounded range on a new scale. Specifically, we can use a logit transformation as our link function:
Here's a plot of $p/(1-p)$
logit = lambda p: np.log(p/(1.-p))
unit_interval = np.linspace(0,1)
plt.plot(unit_interval/(1-unit_interval), unit_interval)
/tmp/ipykernel_139954/2408501820.py:3: RuntimeWarning: divide by zero encountered in true_divide
  plt.plot(unit_interval/(1-unit_interval), unit_interval)
[<matplotlib.lines.Line2D at 0x7f9aea184fd0>]

And here's the logit function:
plt.plot(logit(unit_interval), unit_interval)
/tmp/ipykernel_139954/2408501820.py:1: RuntimeWarning: divide by zero encountered in true_divide
  logit = lambda p: np.log(p/(1.-p))
/tmp/ipykernel_139954/2408501820.py:1: RuntimeWarning: divide by zero encountered in log
  logit = lambda p: np.log(p/(1.-p))
[<matplotlib.lines.Line2D at 0x7f9aea0f44f0>]

The inverse of the logit transformation is:
$$p_i = \frac{1}{1 + \exp(-(\beta_0 + \beta_1 x_i))}$$So, now our model is:
$$\text{logit}(p_i) = \beta_0 + \beta_1 x_i $$We can fit this model using maximum likelihood. Our likelihood, again based on the Bernoulli model is:
$$L(y|p) = \prod_{i=1}^n p_i^{y_i} (1-p_i)^{1-y_i}$$which, on the log scale is:
We can easily implement this in Python, keeping in mind that fmin minimizes, rather than maximizes functions:
invlogit = lambda x: 1. / (1 + np.exp(-x))

def logistic_like(theta, x, y):
    p = invlogit(theta[0] + theta[1] * x)
    # Return negative of log-likelihood
    return -np.sum(y * np.log(p) + (1-y) * np.log(1 - p))
Remove null values from variables
x, y = titanic[titanic.fare.notnull()][['fare', 'survived']].values.T
... and fit the model.
b0 ,b1 = fmin(logistic_like, [0.5,0], args=(x,y))
b0, b1
Optimization terminated successfully.
         Current function value: 827.015955
         Iterations: 47
         Function evaluations: 93
(-0.8823898452833819, 0.012452067664164127)
jitter = np.random.normal(scale=0.01, size=len(x))
plt.plot(x, y+jitter, 'r.', alpha=0.3)
plt.yticks([0,.25,.5,.75,1])
xvals = np.linspace(0, 300)
plt.plot(xvals, invlogit(b0+b1*xvals))
[<matplotlib.lines.Line2D at 0x7f9aea064b80>]

As with our least squares model, we can easily fit logistic regression models in statsmodels, in this case using the GLM (generalized linear model) class with a binomial error distribution specified.
logistic = sm.GLM(y, sm.add_constant(x), family=sm.families.Binomial()).fit()
logistic.summary()
| Dep. Variable: | y | No. Observations: | 1308 |
|---|---|---|---|
| Model: | GLM | Df Residuals: | 1306 |
| Model Family: | Binomial | Df Model: | 1 |
| Link Function: | logit | Scale: | 1.0000 |
| Method: | IRLS | Log-Likelihood: | -827.02 |
| Date: | Sat, 13 Nov 2021 | Deviance: | 1654.0 |
| Time: | 19:31:55 | Pearson chi2: | 1.33e+03 |
| No. Iterations: | 5 | ||
| Covariance Type: | nonrobust |
| coef | std err | z | P>|z| | [0.025 | 0.975] | |
|---|---|---|---|---|---|---|
| const | -0.8824 | 0.076 | -11.684 | 0.000 | -1.030 | -0.734 |
| x1 | 0.0125 | 0.002 | 7.762 | 0.000 | 0.009 | 0.016 |
Estimation
An recurring statistical problem is finding estimates of the relevant parameters that correspond to the distribution that best represents our data.
In parametric inference, we specify a priori a suitable distribution, then choose the parameters that best fit the data.
- e.g. $\mu$ and $\sigma^2$ in the case of the normal distribution
import numpy as np
import pandas as pd
import statsmodels.api as sm
import matplotlib.pyplot as plt


x = np.array([ 1.00201077,  1.58251956,  0.94515919,  6.48778002,  1.47764604,
        5.18847071,  4.21988095,  2.85971522,  3.40044437,  3.74907745,
        1.18065796,  3.74748775,  3.27328568,  3.19374927,  8.0726155 ,
        0.90326139,  2.34460034,  2.14199217,  3.27446744,  3.58872357,
        1.20611533,  2.16594393,  5.56610242,  4.66479977,  2.3573932 ])
plt.hist(x, bins=10)
(array([7., 2., 3., 7., 1., 2., 1., 1., 0., 1.]),
 array([0.90326139, 1.6201968 , 2.33713221, 3.05406762, 3.77100303,
        4.48793844, 5.20487386, 5.92180927, 6.63874468, 7.35568009,
        8.0726155 ]),
 <BarContainer object of 10 artists>)

Fitting data to probability distributions
We start with the problem of finding values for the parameters that provide the best fit between the model and the data, called point estimates. First, we need to define what we mean by ‘best fit’. There are two commonly used criteria:
- Method of moments chooses the parameters so that the sample moments (typically the sample mean and variance) match the theoretical moments of our chosen distribution.
- Maximum likelihood chooses the parameters to maximize the likelihood, which measures how likely it is to observe our given sample.
Discrete Random Variables
$$X = \{0,1\}$$$$Y = \{\ldots,-2,-1,0,1,2,\ldots\}$$Probability Mass Function:
For discrete $X$,
$$Pr(X=x) = f(x|\theta)$$
*e.g. Poisson distribution*
The Poisson distribution models unbounded counts:
$$Pr(X=x)=\frac{e^{-\lambda}\lambda^x}{x!}$$- $X=\{0,1,2,\ldots\}$
- $\lambda > 0$
Continuous Random Variables
$$X \in [0,1]$$$$Y \in (-\infty, \infty)$$Probability Density Function:
For continuous $X$,
$$Pr(x \le X \le x + dx) = f(x|\theta)dx \, \text{ as } \, dx \rightarrow 0$$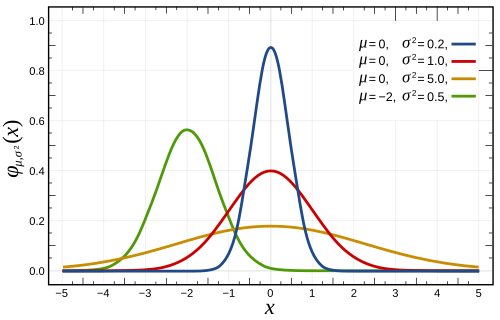
*e.g. normal distribution*
$$f(x) = \frac{1}{\sqrt{2\pi\sigma^2}}\exp\left[-\frac{(x-\mu)^2}{2\sigma^2}\right]$$- $X \in \mathbf{R}$
- $\mu \in \mathbf{R}$
- $\sigma>0$
Example: Nashville Precipitation
The dataset nashville_precip.txt contains NOAA precipitation data for Nashville measured since 1871.
import pandas as pd
precip = pd.read_table("data/nashville_precip.txt", index_col=0,
                       na_values='NA', delim_whitespace=True)
precip
| Jan | Feb | Mar | Apr | May | Jun | Jul | Aug | Sep | Oct | Nov | Dec | |
|---|---|---|---|---|---|---|---|---|---|---|---|---|
| Year | ||||||||||||
| 1871 | 2.76 | 4.58 | 5.01 | 4.13 | 3.30 | 2.98 | 1.58 | 2.36 | 0.95 | 1.31 | 2.13 | 1.65 |
| 1872 | 2.32 | 2.11 | 3.14 | 5.91 | 3.09 | 5.17 | 6.10 | 1.65 | 4.50 | 1.58 | 2.25 | 2.38 |
| 1873 | 2.96 | 7.14 | 4.11 | 3.59 | 6.31 | 4.20 | 4.63 | 2.36 | 1.81 | 4.28 | 4.36 | 5.94 |
| 1874 | 5.22 | 9.23 | 5.36 | 11.84 | 1.49 | 2.87 | 2.65 | 3.52 | 3.12 | 2.63 | 6.12 | 4.19 |
| 1875 | 6.15 | 3.06 | 8.14 | 4.22 | 1.73 | 5.63 | 8.12 | 1.60 | 3.79 | 1.25 | 5.46 | 4.30 |
| ... | ... | ... | ... | ... | ... | ... | ... | ... | ... | ... | ... | ... |
| 2007 | 3.32 | 1.84 | 2.26 | 2.75 | 3.30 | 2.37 | 1.47 | 1.38 | 1.99 | 4.95 | 6.20 | 3.83 |
| 2008 | 4.76 | 2.53 | 5.56 | 7.20 | 5.54 | 2.21 | 4.32 | 1.67 | 0.88 | 5.03 | 1.75 | 6.72 |
| 2009 | 4.59 | 2.85 | 2.92 | 4.13 | 8.45 | 4.53 | 6.03 | 2.14 | 11.08 | 6.49 | 0.67 | 3.99 |
| 2010 | 4.13 | 2.77 | 3.52 | 3.48 | 16.43 | 4.96 | 5.86 | 6.99 | 1.17 | 2.49 | 5.41 | 1.87 |
| 2011 | 2.31 | 5.54 | 4.59 | 7.51 | 4.38 | 5.04 | 3.46 | 1.78 | 6.20 | 0.93 | 6.15 | 4.25 |
141 rows × 12 columns
precip.hist(sharex=True, sharey=True, grid=False, figsize=(10,6))
plt.tight_layout()

The first step is recognixing what sort of distribution to fit our data to. A couple of observations:
- The data are skewed, with a longer tail to the right than to the left
- The data are positive-valued, since they are measuring rainfall
- The data are continuous
The gamma distribution is often a good fit to aggregated rainfall data, and will be our candidate distribution in this case.
$$x \sim \text{Gamma}(\alpha, \beta) = \frac{\beta^{\alpha}x^{\alpha-1}e^{-\beta x}}{\Gamma(\alpha)}$$
The *method of moments* simply assigns the empirical mean and variance to their theoretical counterparts, so that we can solve for the parameters.
So, for the gamma distribution, the mean and variance are:
$$ \hat{\mu} = \bar{X} = \alpha \beta $$$$ \hat{\sigma}^2 = S^2 = \alpha \beta^2 $$So, if we solve for these parameters, we can use a gamma distribution to describe our data:
$$ \alpha = \frac{\bar{X}^2}{S^2}, \, \beta = \frac{S^2}{\bar{X}} $$Let's deal with the missing value in the October data.
precip.Oct.loc[1960:1970]
Year
1960    1.38
1961    1.12
1962    2.29
1963     NaN
1964    1.83
1965    0.57
1966    2.50
1967    1.57
1968    3.92
1969    2.01
1970    2.94
Name: Oct, dtype: float64
Given what we are trying to do, it is most sensible to fill in the missing value with the average of the available values.
precip.fillna(value={'Oct': precip.Oct.mean()}, inplace=True)
precip
| Jan | Feb | Mar | Apr | May | Jun | Jul | Aug | Sep | Oct | Nov | Dec | |
|---|---|---|---|---|---|---|---|---|---|---|---|---|
| Year | ||||||||||||
| 1871 | 2.76 | 4.58 | 5.01 | 4.13 | 3.30 | 2.98 | 1.58 | 2.36 | 0.95 | 1.31 | 2.13 | 1.65 |
| 1872 | 2.32 | 2.11 | 3.14 | 5.91 | 3.09 | 5.17 | 6.10 | 1.65 | 4.50 | 1.58 | 2.25 | 2.38 |
| 1873 | 2.96 | 7.14 | 4.11 | 3.59 | 6.31 | 4.20 | 4.63 | 2.36 | 1.81 | 4.28 | 4.36 | 5.94 |
| 1874 | 5.22 | 9.23 | 5.36 | 11.84 | 1.49 | 2.87 | 2.65 | 3.52 | 3.12 | 2.63 | 6.12 | 4.19 |
| 1875 | 6.15 | 3.06 | 8.14 | 4.22 | 1.73 | 5.63 | 8.12 | 1.60 | 3.79 | 1.25 | 5.46 | 4.30 |
| ... | ... | ... | ... | ... | ... | ... | ... | ... | ... | ... | ... | ... |
| 2007 | 3.32 | 1.84 | 2.26 | 2.75 | 3.30 | 2.37 | 1.47 | 1.38 | 1.99 | 4.95 | 6.20 | 3.83 |
| 2008 | 4.76 | 2.53 | 5.56 | 7.20 | 5.54 | 2.21 | 4.32 | 1.67 | 0.88 | 5.03 | 1.75 | 6.72 |
| 2009 | 4.59 | 2.85 | 2.92 | 4.13 | 8.45 | 4.53 | 6.03 | 2.14 | 11.08 | 6.49 | 0.67 | 3.99 |
| 2010 | 4.13 | 2.77 | 3.52 | 3.48 | 16.43 | 4.96 | 5.86 | 6.99 | 1.17 | 2.49 | 5.41 | 1.87 |
| 2011 | 2.31 | 5.54 | 4.59 | 7.51 | 4.38 | 5.04 | 3.46 | 1.78 | 6.20 | 0.93 | 6.15 | 4.25 |
141 rows × 12 columns
Now, let's calculate the sample moments of interest, the means and variances by month:
precip_mean = precip.mean()
precip_mean
Jan    4.523688
Feb    4.097801
Mar    4.977589
Apr    4.204468
May    4.325674
Jun    3.873475
Jul    3.895461
Aug    3.367305
Sep    3.377660
Oct    2.610500
Nov    3.685887
Dec    4.176241
dtype: float64
precip_var = precip.var()
precip_var
Jan    6.928862
Feb    5.516660
Mar    5.365444
Apr    4.117096
May    5.306409
Jun    5.033206
Jul    3.777012
Aug    3.779876
Sep    4.940099
Oct    2.741659
Nov    3.679274
Dec    5.418022
dtype: float64
We then use these moments to estimate $\alpha$ and $\beta$ for each month:
alpha_mom = precip_mean ** 2 / precip_var
beta_mom = precip_var / precip_mean
estimates = pd.DataFrame({'alpha_mom': alpha_mom, 'beta_mom': beta_mom})
estimates
| alpha_mom | beta_mom | |
|---|---|---|
| Jan | 2.953407 | 1.531684 |
| Feb | 3.043866 | 1.346249 |
| Mar | 4.617770 | 1.077920 |
| Apr | 4.293694 | 0.979219 |
| May | 3.526199 | 1.226724 |
| Jun | 2.980965 | 1.299403 |
| Jul | 4.017624 | 0.969593 |
| Aug | 2.999766 | 1.122522 |
| Sep | 2.309383 | 1.462581 |
| Oct | 2.485616 | 1.050243 |
| Nov | 3.692511 | 0.998206 |
| Dec | 3.219070 | 1.297344 |
We can use the gamma.pdf function in scipy.stats.distributions to plot the ditribtuions implied by the calculated alphas and betas. For example, here is January:
from scipy.stats import gamma

xvals = np.linspace(0, 10)
yvals = gamma.pdf(xvals, alpha_mom[0], beta_mom[0])
precip.Jan.hist(bins=20, density=1)
plt.plot(xvals, yvals)
[<matplotlib.lines.Line2D at 0x7f9ae9a438b0>]

Looping over all months, we can create a grid of plots for the distribution of rainfall, using the gamma distribution:
axs = precip.hist(density=1, figsize=(12, 8), sharex=True, sharey=True, bins=15, grid=False)

for ax in axs.ravel():
    # Get month
    m = ax.get_title()
    # Plot fitted distribution
    x = np.linspace(*ax.get_xlim())
    ax.plot(x, gamma.pdf(x, alpha_mom[m], beta_mom[m]))
    label = 'alpha = {0:.2f}\nbeta = {1:.2f}'.format(alpha_mom[m], beta_mom[m])
    ax.annotate(label, xy=(10, 0.2))

plt.xlim([0, 15])
plt.tight_layout()

Maximum Likelihood
Maximum likelihood (ML) fitting is usually more work than the method of moments, but it is preferred as the resulting estimator is known to have good theoretical properties.
There is a ton of theory regarding ML. We will restrict ourselves to the mechanics here.
Say we have some data $y = y_1,y_2,\ldots,y_n$ that is distributed according to some distribution:
$$Pr(Y_i=y_i | \theta)$$Here, for example, is a Poisson distribution that describes the distribution of some discrete variables, typically counts:
y = np.random.poisson(5, size=100)
plt.hist(y, bins=int(np.sqrt(len(y))), density=1)
plt.xlabel('y'); plt.ylabel('Pr(y)')
Text(0, 0.5, 'Pr(y)')

The product $\prod_{i=1}^n Pr(y_i | \theta)$ gives us a measure of how likely it is to observe the set of values $y_1,\ldots,y_n$ given the parameters $\theta$. Maximum likelihood fitting consists of choosing the appropriate function $l= Pr(Y|\theta)$ to maximize for a given set of observations. We call this function the likelihood function, because it is a measure of how likely the observations are if the model is true.
Given these data, how likely is this model?
In the above model, the data were drawn from a Poisson distribution with parameter $\lambda =5$.
$$L(y|\lambda=5) = \frac{e^{-5} 5^y}{y!}$$So, for any given value of $y$, we can calculate its likelihood:
def poisson_dens(y, lam):
    return np.exp(-lam) * (lam**y) / (np.arange(y)+1).prod()

lam = 6
value = 10
poisson_dens(value, lam)
0.041303093412337726
sum(poisson_dens(yi, lam) for yi in y)
12.157642033131616
lam = 8
sum(poisson_dens(yi, lam) for yi in y)
8.268378723048146
We can plot the likelihood function for any value of the parameter(s):
lambdas = np.linspace(0, 15)
x = 5
plt.plot(lambdas, [poisson_dens(x, l) for l in lambdas])
plt.xlabel('$\lambda$')
plt.ylabel('L($\lambda$|x={0})'.format(x));

How is the likelihood function different than the probability distribution (or mass) function? The likelihood is a function of the parameter(s) given the data, whereas the PDF returns the probability of data given a particular parameter value. Here is the PMF of the Poisson for $\lambda=5$.
lam = 5
xvals = np.arange(15)
yvals = [poisson_dens(x, lam) for x in xvals]
plt.bar(xvals, yvals)
plt.xlabel('x')
plt.ylabel('Pr(X|$\lambda$=5)');

Why are we interested in the likelihood function?
A reasonable estimate of the true, unknown value for the parameter is one which maximizes the likelihood function. So, inference is reduced to an optimization problem.
Going back to the rainfall data, if we are using a gamma distribution we need to maximize:
$$\begin{align}l(\alpha,\beta) &= \sum_{i=1}^n \log[\beta^{\alpha} x_i^{\alpha-1} e^{-x/\beta}\Gamma(\alpha)^{-1}] \cr &= n[(\alpha-1)\overline{\log(x)} - \bar{x}\beta + \alpha\log(\beta) - \log\Gamma(\alpha)]\end{align}$$(Its usually easier to work in the log scale)
where $n = 2012 − 1871 = 141$ and the bar indicates an average over all i. We choose $\alpha$ and $\beta$ to maximize $l(\alpha,\beta)$.
Notice $l$ is infinite if any $x$ is zero. We do not have any zeros, but we do have an NA value for one of the October data, which we dealt with above.
Finding the MLE
To find the maximum of any function, we typically take the derivative with respect to the variable to be maximized, set it to zero and solve for that variable.
$$\frac{\partial l(\alpha,\beta)}{\partial \beta} = n\left(\frac{\alpha}{\beta} - \bar{x}\right) = 0$$Which can be solved as $\beta = \alpha/\bar{x}$. However, plugging this into the derivative with respect to $\alpha$ yields:
$$\frac{\partial l(\alpha,\beta)}{\partial \alpha} = \log(\alpha) + \overline{\log(x)} - \log(\bar{x}) - \frac{\Gamma(\alpha)'}{\Gamma(\alpha)} = 0$$This has no closed form solution. We must use *numerical optimization*!
Numerical optimization alogarithms take an initial "guess" at the solution, and iteratively improve the guess until it gets "close enough" to the answer.
Here, we will use Newton-Raphson algorithm:
Which is available to us via SciPy:
from scipy.optimize import newton
Here is a graphical example of how Newton-Raphson converges on a solution, using an arbitrary function:
# some function
func = lambda x: 3./(1 + 400*np.exp(-2*x)) - 1
xvals = np.linspace(0, 6)
plt.plot(xvals, func(xvals))
plt.text(5.3, 2.1, '$f(x)$', fontsize=16)

# zero line
plt.plot([0,6], [0,0], 'k-')

# value at step n
plt.plot([4,4], [0,func(4)], 'k:')
plt.text(4, -.2, '$x_n$', fontsize=16)

# tangent line
tanline = lambda x: -0.858 + 0.626*x
plt.plot(xvals, tanline(xvals), 'r--')

# point at step n+1
xprime = 0.858/0.626
plt.plot([xprime, xprime], [tanline(xprime), func(xprime)], 'k:')
plt.text(xprime+.1, -.2, '$x_{n+1}$', fontsize=16)
Text(1.4706070287539936, -0.2, '$x_{n+1}$')

To apply the Newton-Raphson algorithm, we need a function that returns a vector containing the first and second derivatives of the function with respect to the variable of interest. In our case, this is:
from scipy.special import psi, polygamma

dlgamma = lambda m, log_mean, mean_log: np.log(m) - psi(m) - log_mean + mean_log
dl2gamma = lambda m, *args: 1./m - polygamma(1, m)
where log_mean and mean_log are $\log{\bar{x}}$ and $\overline{\log(x)}$, respectively. psi and polygamma are complex functions of the Gamma function that result when you take first and second derivatives of that function.
# Calculate statistics
log_mean = precip.mean().apply(np.log)
mean_log = precip.apply(np.log).mean()
Time to optimize!
# Alpha MLE for December
alpha_mle = newton(dlgamma, 2, dl2gamma, args=(log_mean[-1], mean_log[-1]))
alpha_mle
3.518967915239979
And now plug this back into the solution for beta:
beta_mle = alpha_mle/precip.mean()[-1]
beta_mle
0.842616075484142
We can compare the fit of the estimates derived from MLE to those from the method of moments:
dec = precip.Dec
dec.hist(density=True, bins=10, grid=False)
x = np.linspace(0, dec.max())
plt.plot(x, gamma.pdf(x, alpha_mom[-1], beta_mom[-1]), 'm-')
#plt.plot(x, gamma.pdf(x, alpha_mle, beta_mle), 'r--')
plt.plot(x, gamma.pdf(x, alpha_mle, beta_mle), 'r--')
[<matplotlib.lines.Line2D at 0x7f9ae16c5ca0>]

For some common distributions, SciPy includes methods for fitting via MLE:
from scipy.stats import gamma

ahat, _, bhat = gamma.fit(precip.Dec, floc=0)
ahat, 1./bhat
Note that SciPy's gamma.fit method fits a slightly different version of the gamma distribution, which has to be transformed to match ours.
Kernel density estimates*
In some instances, we may not be interested in the parameters of a particular distribution of data, but just a smoothed representation of the data at hand. In this case, we can estimate the disribution non-parametrically (i.e. making no assumptions about the form of the underlying distribution) using kernel density estimation.
# Some random data
y = np.random.random(15) * 10
y
from scipy.stats import norm

# Create an array of x-valuese``````````````````````````````
x = np.linspace(y.min()-1, y.max()+1, 100)

# Smoothing parameter
s = 0.4

# Calculate the kernels
kernels = np.transpose([norm.pdf(x, yi, s) for yi in y])
plt.plot(x, kernels, 'k:')
plt.plot(x, kernels.sum(1))
plt.plot(y, np.zeros(len(y)), 'ro', ms=10)
SciPy implements a Gaussian KDE that automatically chooses an appropriate bandwidth. Let's create a bi-modal distribution of data that is not easily summarized by a parametric distribution:
# Create a bi-modal distribution with a mixture of Normals.
x1 = np.random.normal(0, 2, 50)
x2 = np.random.normal(4, 1, 50)

# Append by row
x = np.r_[x1, x2]
plt.hist(x, bins=10, density=True)
from scipy.stats import kde

density = kde.gaussian_kde(x)
xgrid = np.linspace(x.min(), x.max(), 100)
plt.hist(x, bins=10, density=True)
plt.plot(xgrid, density(xgrid), 'r-')
Bootstrapping*
Parametric inference can be non-robust:
- inaccurate if parametric assumptions are violated
- if we rely on asymptotic results, we may not achieve an acceptable level of accuracy
Parmetric inference can be difficult:
- derivation of sampling distribution may not be possible
An alternative is to estimate the sampling distribution of a statistic empirically without making assumptions about the form of the population.
We have seen this already with the kernel density estimate.
Non-parametric Bootstrap
The bootstrap is a resampling method discovered by Brad Efron that allows one to approximate the true sampling distribution of a dataset, and thereby obtain estimates of the mean and variance of the distribution.
Bootstrap sample:
$S_i^*$ is a sample of size $n$, with replacement.
The NumPy function permutation can be used to generate a random sample of some data without replacement:
np.random.permutation(titanic.name)[:5]
Similarly, we can use the random.randint method to generate a sample with replacement, which we can use when bootstrapping.
random_ind = np.random.randint(0, len(titanic), 5)
titanic.name[random_ind]
We regard S as an "estimate" of population P
population : sample :: sample : bootstrap sample
The idea is to generate replicate bootstrap samples:
Compute statistic $t$ (estimate) for each bootstrap sample:
n = 10
R = 1000
# Original sample (n=10)
x = np.random.normal(size=n)
# 1000 bootstrap samples of size 10
s = [x[np.random.randint(0,n,n)].mean() for i in range(R)]
_ = plt.hist(s, bins=30)
Bootstrap Estimates
From our bootstrapped samples, we can extract estimates of the expectation and its variance:
$$\bar{T}^* = \hat{E}(T^*) = \frac{\sum_i T_i^*}{R}$$$$\hat{\text{Var}}(T^*) = \frac{\sum_i (T_i^* - \bar{T}^*)^2}{R-1}$$boot_mean = np.sum(s)/R
boot_mean
boot_var = ((np.array(s) - boot_mean) ** 2).sum() / (R-1)
boot_var
Since we have estimated the expectation of the bootstrapped statistics, we can estimate the bias of T:
$$\hat{B}^* = \bar{T}^* - T$$boot_mean - np.mean(x)
Bootstrap error
There are two sources of error in bootstrap estimates:
- Sampling error from the selection of $S$.
- Bootstrap error from failing to enumerate all possible bootstrap samples.
For the sake of accuracy, it is prudent to choose at least R=1000
Bootstrap Percentile Intervals
An attractive feature of bootstrap statistics is the ease with which you can obtain an estimate of uncertainty for a given statistic. We simply use the empirical quantiles of the bootstrapped statistics to obtain percentiles corresponding to a confidence interval of interest.
This employs the ordered bootstrap replicates:
$$T_{(1)}^*, T_{(2)}^*, \ldots, T_{(R)}^*$$Simply extract the $100(\alpha/2)$ and $100(1-\alpha/2)$ percentiles:
$$T_{[(R+1)\alpha/2]}^* \lt \theta \lt T_{[(R+1)(1-\alpha/2)]}^*$$s_sorted = np.sort(s)
s_sorted[:10]
s_sorted[-10:]
alpha = 0.05
s_sorted[[int((R+1)*alpha/2), int((R+1)*(1-alpha/2))]]